If you are one of my students, please see
http://www.drallensmith.org/teaching/index.html
before you read this page - some of the material on it may be out of date
with respect to how the course is being done currently.
If you are thinking I am the person to send InsightII tutorials to, please see
my tutorials page.
Back to Home Page
My Teaching: TAing Experimental Biochemistry - 2004-2005 webpage
I TA one of the labs in the course
Experimental Biochemistry
(also see
the spring semester course description),
with the professor for that course being
Dr. Theodore Chase,
including supervision of students in the laboratory, helping students with
lab reports, grading of some lab reports, and helping grade the final exams.
Below, you will find:
- any information that I need to get to
students (or would like to make available to students) right now
- any comments about the course that I wish to
make
- a HTMLized version of the intro sheet that I
normally give out at the beginning of each semester.
For the 2001-2002 web-page, see
http://www.drallensmith.org/teaching/index.old.html.
For the 2002-2003 web-page, see
http://www.drallensmith.org/teaching/index.2002-2003.html.
For the 2003-2004 web-page, see
http://www.drallensmith.org/teaching/index.2003-2004.html.
I am afraid the below is somewhat out of date, at least with regard to the
Intro section and below it.
9/7/04:
We are not requiring prelabs, at least for the Tuesday labs. Nor do I plan
on requiring them for the Tuesday labs next semester.
9/9/04:
I have so far gotten two people's emails to let me know what their email
addresses are. I may decide to count in whether people send them into
people's subjective - or quiz - grades...
10/1/04:
I will be grading the protein labs, which are due October 26th and 27th
(Tuesday and Wednesday labs, respectively). (I will be available for
consultation on these, probably in the afternoon/evening (I will announce
further later on), from Saturday, Oct 23rd to Wednesday, Oct 27th; I may be
available at other times, but email me first to make sure.) You will need to
turn in a copy of your answers to the protein lab questions on a (3.5 floppy)
disk, with your name on the disk (especially if you want the disk back!) and
the file name of the questions on the disk also including your name (e.g.,
for me it would be something like Allen_Smith.txt). The file can be in plain
text (preferred) or several other common formats - if you don't know how to
do plain text, please use RichText (RTF) or Micro$oft Word. (It will be
being uploaded to turnitin.com, which will check to make sure that answers
to questions - which must be done seperately! - are not overly similar (we
will ignore similarities due to, say, correct calculations being the same,
of course!).) You also should print out a copy and put it with the rest of
your lab report, for me to use while grading. In general, you will not be
counted as having the questions in until both the printout and the disk are
in. Please note that I prefer having things typed, except for calculations,
although don't worry about typing up the datasheets for this lab if your
handwriting is reasonably legible on said datasheets. Except for the
questions, typing the lab report is not a requirement - but it will
make me happier while I am grading them!
10/4/04:
My apologies; no, they have not been pushed back to the 26th and 27th; they
are due the 12th and 13th (next week). Yes, we're aware that the biochem exam
is on Monday; sorry! I should be available for consultation that Monday,
Tuesday, and Wednesday as follows (for earlier, please check here later):
- Monday
- After the Biochem final (give me half an hour to recover) until
midnight/later
- Tuesday
- 9:30 AM until 1:00PM
During the Tuesday lab (1:00PM-?)
if not too busy
That evening after the Tuesday lab (give me at least an hour
after the Tuesday lab to recover, please) until 1:00AM or
later
- Wednesday
- 1:00PM until 1:00AM or later
10/9/04:
There are only 5 unknown substances named in the lab manual, but there are
6 unknown substances. The remaining one is protamine sulfate. (I am in
Lipman this (Saturday) evening.)
10/11/04:
Two things:
Where question 6 reads "y estimates", read "y
intercepts", and similarly where it reads "y estimate", read "y
intercept".
- It is possible that the estimated concentration of the unknown
protein will differ on one of the methods from that found using the
other three methods. (It should not differ by a factor of three or
more, however.) This is because of the identity of the unknown
protein.
10/12/04:
My apologies for not being in at 9:30/10:00 - I overslept! (Now you see why
I do not TA the Wednesday morning lab...) I will be in tonight
until late - as in until sometime in the morning (1:00AM or later). If the
lab is in to me before I leave in the morning (or before Dr. Chase gets here
in the morning, whichever happens first), it is in today. The same will be
true Wednesday night (it will be counted as in on Wednesday if I get it
before I leave that night/Thursday morning).
If a lab report gets to me prior to my updating this web page, I will take
this into account in regard to whether you followed what I said to do after
the update. However, you are responsible for keeping up with this
page (in regard to lab reports that I am grading, and for everyone in the
Tuesday lab in general) for anything turned in after it is
updated.
Two things on the statistics and computer work in general:
- It is possible to do all of the graphs and equations in Excel,
provided that your copy of Excel has the "Analysis ToolPak"
add-in. Go to the "Tools" menu, click on "Add-ins", and make sure
that "Analysis ToolPak" is present and the box beside it is
checked. If this is so, you can do linear regression with getting
all the necessary standard errors and other values by going to the
"Tools" menu, clicking on "Data Analysis", and selecting
"Regression".
- I can let you into the building, and into the PC lab that has
SigmaPlot, if you call 732-932-9255 x119 when you get here, although
I prefer it if you call one of your friends who is already in so
that I don't have to constantly be going to the door. (If you
anticipate this happening a lot, talk to Dr. Chase and Peter
Anderson about getting a slashcard for the building. This will also
let you into 202 (the SGI computer lab - for the tutorials), and I
can let you into 202 if I recognize you. The department is
not distributing slashcards to all students in General Biochemistry
due to theft and safety problems; it is possible that we may be able
to give them just to people in Experimental Biochemistry, but this
decision is not up to me (Dr. Chase will have to talk to the other
professors in the department about it.)
Regarding question number 6:
- I am sorry, you do not use the standard error of the y
intercept instead of the standard error of the y estimate, you use
the standard error of the overall curve, which may be called:
- The standard error of the y estimate (lab manual)
- The standard error of the estimate (SigmaPlot)
- The standard error of the curve
- The Root Mean Square (RMS) error
Or something else, depending on what computer program you are
working with, unfortunately! You can also work it out from the
standard errors of the slope and y intercept, using the formula that
Dr. Chase gave in his (corrected) handout this
morning. (The handout is entitled "Comparing Standard
Deviations of Averages and Slopes". (It should have been titled
"Comparing Standard Errors of Averages and Slopes", BTW.))
Correction: the formula in the handout is allegedly capable of
telling you the standard error of the x estimate for a particular x
estimate, if you want the standard error of the x estimate. The
easier way to do this is to plot the absorbances on the x axis and
plot the mg (or ml, for the unknown) on the y axis, plot
this line (which gives you an equation that you can just
plug the absorbance values into and get the mg, for the standard
curve), and find out the standard error that way from a program that
will give you the standard error of the "y estimate".
- So far as I can tell, you can't get the standard error of the "y
estimate" from Kalidagraph, which is ridiculous. If Excel (by
Microsloth) can do it, Kalidagraph should be able to
do it. As it is, I am recommending using SigmaPlot (do not use
Linear Regression, use the Regression Wizard) or, much as I hate
Micro$oft, Excel. You are
required to give the standard error of the "y estimate" for question
6, so do not use Kalidagraph, unless you can figure out some way to
get it to tell you the standard error (in which case please tell
myself and/or Dr. Chase about it!).
- Dr. Chase and Dr. Kahn disagree over whether you need to combine
the standard error of the mean concentrations with the standard
error of the x estimate of the standard curve in order to see how
big the standard error of the mean method is. I am therefore not
going to require people to combine them. If you find that the
standard error of the mean method, not combining it with the
standard error of the x estimate of the standard curve, is smaller
than the standard error of the slope method, that may be an argument
for combining them, if when I look at the values you get vs the
actual concentrations the estimates from the slope method are more
accurate than the estimates from the mean method (which I anticipate
being the case). (No, I will not count off for your estimates being
far from the actual concentrations. You got the data you got.) If
you are combining the standard error of the x estimate with
the standard error of the mean, note that that is the x
estimate, not the y estimate.
- You do not actually have to plot the deviations (residuals) if
you can see that the points are curved (and how) by looking at them
on the plots you have already done. You just need to state if they
are curved and, if so, how. You still need to do the subtraction it
mentions (to get the deviations/residuals), or look at the Residuals
that SigmaPlot and Excel can produce if you set the proper settings,
in order to find out if the values fall outside the standard error
of the y intercept.
Regarding question number 1, for "standard deviation", read "standard error"
You cannot compare the standard deviation of the slope methods with the
standard deviation of the averaging methods, since the slope methods do not
have a standard deviation. Both have a standard error, however.
Glycylglycine is not one of the
unknowns. Instead, where the lab report says "glycylglycine", read
"glycylglycylglycine" (as in glycine peptide-bonded to glycine
peptide-bonded to a third glycine; that is two peptide bonds).
Tyrosine and tryptophan do not necessarily absorb exactly twice as
much at 280 nanometers as at 260 nm. They should absorb
significantly more at 280 than they do at 260. Similarly, RNA (or other
nucleic acids - the only nucleic acid among your unknown substances is RNA)
does not necessarily absorb twice as much at 260 as at 280, but it should
absorb significantly more at 260 as at 280.
You can remove points if you have reason to, such as if the absorbances are
going down with increasing amounts of protein, provided that:
- You say that you did so, and what the reason is.
- You do not remove the 0,0 point (for those methods that have it
- the Coomassie does not).
- You leave at least 3 other points than the 0,0 point.
This is particularly likely to be necessary for the point with the smallest
amount of protein (remember the pipetting/dilution lab?) and, on the
Coomassie, for the one or two points at the highest amount of protein
(unless said points have Y values near those for the unknown protein, in
which case you may need to take out some of the lowest points). But
it may not be necessary in your particular case - look at the data and
decide. (One way to tell: if the R-squared value for the line is less than
0.95 or so, you probably need to take out some points. If the R-squared is
greater than 0.99 or so, you probably do not need to take out some
points. But you have to judge based on the situation.)
On question 4:
- The simplest way to find the absorbance per mg protein is to
look at the slope of the standard curve. It is absorbance (the Y
axis) vs mg (the X axis) - change in Y over change in X.
For the E1mg/ml, divide that slope by the mLs in
the cuvette for each method (3 mL for each). (It could be argued
that you should use the maximum amount of protein solution that you
can use for that method - that matters more in some
circumstances. I will accept either interpretation.)
Multiply, not divide, and by the amount of protein solution
before you put it into the cuvette, not the amount in the
cuvette!
- I will accept for the Coomassie Blue using either the
A595/A466 or the A595 for the curve
from which to get the slope. (I can see arguments both ways...)
Remember that all of the methods except for the Coomassie Blue will have a
0,0 point, on both the standard curve graph and the unknown graph. The
Coomassie Blue will have a 0 mg protein point that will be above 0 for both
the A595/A466 and A595 graphs (you can do
them on the same graph or on two different graphs, it does not matter
which). You will then copy these points from the standard curves to the unknown
curves, since 0 mg ovalbumin = 0 ml unknown protein. (No protein is no
protein!)
On page 5, the lab manual talks about comparing the standard deviations of
the slope and intercept for the Coomassie Blue
A595/A466 and A595. There is no such thing.
You compare the standard errors of the slope and intercept. Where it says
"as a percentage of the mean value", it means "divide the standard error by
the slope" for the standard error of the slope, and "divide the standard
error by the intercept" for the standard error of the intercept, then
multiply by 100 to get a percentage.
Note that I have updated my contact information -
if it is at night and you cannot reach me via extension 119 or extension
202, please try extension 207. That will ring close by the PC computer lab
(which unfortunately does not have a phone of its own) and I should hear it
if I am up there (or someone else should hear it and answer). (Of course,
please try email first if possible!)
10/13/04:
A few things:
- You do not have to try to fit both graphs for Coomassie
(as in the A595/A466 and A595), or
for that matter any other of the methods where you could possibly
graph two different wavelengths (e.g., Biuret), onto the same
graph. Fancy is not required.
- You can also turn in your answers to the questions on a CD, if
that is more convenient for you (than a floppy disk) for some
reason.
- You do not need to turn in on the disk (or CD) anything other
than the text you wrote (and should write
seperately from others!) in answering the
questions. (For instance, this should include your explanation of
how you figured out what letter was what unknown substance.) Unless you
have already put this into the lab report copy on your disk, please
do not include copies of the SigmaPlot or Excel statistical
reports, etcetera in what is on the disk. (That material would be
the same for everyone using a given version of the program, except
for variations in the numbers - which will not be there within a lab
group - so would give "false positives" in the turnitin.com
analysis.) These reports should be part of the printed-out
portion of your report.
10/15/04:
Again, a few things:
- I will be here this weekend (not sure exactly what hours as yet
- my sleep cycle is hard to predict even for me!), and can let
people into the building and into the PC computer lab in 214 - and,
of course, can accept lab reports and disks - but will not be
available for much assistance - I have a presentation to give on
Monday that I need to prepare for (locating and reading over
background papers, for one thing...).
- Hopefully, you've gotten past this stage by now, but note that
if you copied down the Coomassie ratio from what the
spectrophotometer produced, depending on how the spec was set, it
may actually be the reciprocal of the ratio desired - as in
it may have given you A466/A595 instead of
A595/A466.
- Some people have had some degree of confusion on what the
unknown substances are that you are trying to match and, more
importantly, give reasons for matching to your A-F
samples. They are, in reverse alphabetical (not A-F sample!) order:
- Protamine sulfate is notable for being high in arginines and, to
a lesser degree, low in tyrosines and tryptophans. Despite having a
sulfate, no, it does not react especially in the Lowry reaction.
- You do not need to plot absorbance vs concentration, only
absorbance vs mg (for the standards) and absorbance vs ml (for the
unknown protein).
- You do not need to plot the absorbances of the unknown
substances or of the interfering substances.
10/18/04:
I am sorry that I have not been available today and had not let people know
this. Unless Dr. Chase objects, I will not count today (10/18/04) against
days late - in other words, if you turn in something Tuesday (10/19/04), it
will be counted as in on Monday (10/18/04).
10/20/04:
I am still available for help with the protein lab, although I am hoping
that when I go through them I will find that everyone has turned them
in. (Said help would also include allowing you to make a copy of your Lowry
results for use in the enzyme lab, if you didn't keep a copy or something
happened to your copy.) I can also give some assistance on the enzyme lab,
although not quite as much as on the protein lab - for one thing, Dr. Chase
is grading the enzyme lab (I would run screaming if asked to grade it...). I
can try to give assistance on the carbohydrate lab, but
carbohydrates (aside from those in nucleic acids) are really not my area - I
am a biologist, not a chemist. I am likely to send you to Dr. Chase or
Dr. VanEs for help on many questions, since I really don't want to tell you
something wrong.
BTW, speaking of telling you something wrong, I am afraid I badly
underestimated the time required on Monday (or on Tuesday for the Wednesday
section) for doing the prep for the next day's lab - I had completely
forgotten about the dialysis! Sorry about that... it will probably take
anywhere between 45 minutes to an hour.
10/21/04:
Do not try yanking on the side door to try to get into the
building! Doing so damages the door lock mechanism - we have had to have it
repaired or replaced several times in the past. If I catch anyone doing so
now that you have been notified not to do it, I will do my best to see to it
that the person is:
- Brought up on charges for damaging Rutgers property,
- Flunked, or
- Both.
(I place bringing up on charges first because anyone dumb enough to do it
when you have been warned is probably going to flunk anyway...)
Incidentally, with regard to InsightII, what I know (fairly well IMO) is how
to work with the computers themselves - stuff with the command line, logging
in, etcetera. I had to take (an earlier version of) the tutorials myself a
couple of years ago, and found them rather thoroughly frustrating.
10/23/04:
I will do my best to have the disks available on Monday to give back to you
so that you can use them again for putting stuff on disk (namely, for the
Carbohydrate Lab, the Conclusions (as mentioned on page 14) and Questions
(except the calculations from Questions 5 and 7)) for going to turnitin.com;
sorry I do not have them available already! I will try to announce their
availability, and remind you about coming in to do the dialysis, in General
Biochemistry on Monday, but this may not be possible due to time
constraints. (Please try not to bug me - especially calling to be let into
the building - unnecessarily, so that I can have some time to upload stuff
and hopefully start on grading. If someone is in 202 and can let you in,
call that room (extension 202) first, not mine, for instance. However, feel
free to email questions or a request to come by and see me.)
Either Dr. Chase or Laura is grading the Carbohydrate Lab - ask Dr. Chase
for which. Note that Dr. Chase is rather pickier than I am about graphs not
being so similar to each other they could have been xeroxed, even when it is
simply because everyone is using the default symbols et al - ask Laura for
how picky she will be if she is the one grading it.
10/24/04:
I now have the disks (or equivalent) of the following available to be handed
back:
- Tuesday:
- Matt A
- Polina A
- Eric C
- Melinda C
- Kathy D
- Anthony D
- Brett E
- Kevin G
- Natalie K
- Vicky L
- Philip O
- Brandon S
- Carlos S-A
- Salvator S
- Aaron S
- Melissa T
- Stephanie V
- Keenon W
- Wednesday:
- Jessica A
- Chinelo A
- Rashmi B
- Ankur D
- Dante D-G
- Parth D
- Christina D
- Steve G
- Rozina H
- Daniel K
- Cisilya K
- Paulo L
- Purvaja N
- Chioma N
- Vishaal P
- Kristen S
- Scott V
For future note:
- Be sure, as I said before, to put your name in the name of the
file, ideally at the start of the name of the file.
- If there are multiple files on the disk, please make sure that
it is absolutely clear which file contains what you are required to
submit on the disk.
- Please do not use Microsoft Works (giving the file the
".wps" ending).
- Please make sure the disk works via reading back the file on
another computer. (One computer may have a disk drive that is
badly adjusted such that it produces disks and disk files readable
on that computer, but not on some or all other computers.)
10/25/04:
I have the following additional disks available to be handed back:
- Lena S
- Justin C
- Maria M
- Hedai C
With the exception of the first, I do not advise using that
particular disk again, since it did not work consistently (that is why they
took longer - I had to find a computer on which they would work).
10/30/04:
Do not disturb me any more than absolutely necessary today or tomorrow; I
have:
- your protein labs to finish grading (hopefully by Tuesday)
- a presentation to do on Monday
- computer problems to solve
You can contact me to turn in a carbohydrate (or other) lab or to be let
into the building (the door to 202 is currently propped open). Other than
that, do not disturb!
10/31/04:
Please try calling extensions 202 (the SGI computer lab for the tutorials)
and 207 (the one closest to the PC lab) before calling 119. If you are in or
near 202 or 207, please pick up the phone if it rings, and get the door if
appropriate. If you are in the PC lab, do not close the door, and keep the
door to 207 propped open, so that you can hear it ringing. (As well as being
rather busy at the moment, I hate talking on the phone, plus I'm working on
what is a religious holiday - Samhain,
aka Halloween - for me (as I usually do, and, to be blunt, have problems
with that other people refuse to work on theirs), which does not put me in
the best of moods.)
11/16/04:
Wednesday people: If at all possible, please calculate the activity
(pyruvate assay) for the samples that you will be running on a native gel on
Wednesday. (That's the final and the dialyzed precipitate.) Sorry about not
letting you know before this - both myself and Dr. Chase forgot!
The non-prestained (single color, only showed up after staining with
coomassie blue) standards are the ones given in the lab manual; the carbonic
anhydrase band tends to be the heaviest, with two bands moving further than
it and two bands not as far (no phosphorylase b protein - she did use one
very large protein, but it doesn't seem to have shown up on any of the gels
I've seen so far). For the prestained
standards, see below. Incidentally, regarding the
gels/blots and the mention of 'drawings' - you do not have to do
full drawings of any of them, if you have a picture
and you have drawn on it where the bands are that you
measured. This isn't an art class...
I will be in this weekend and available for assistance with the enzyme labs,
although please keep in mind that I am not able to be authoritative on those
- I am not the one grading them. I can help more than I can for the
carbohydrate labs, however! (The only carbohydrates I generally deal with on
a scientific basis are nucleic acids...)
The prestained standards (multicolor) are as per
the ones on Emilia's door, the Kalideoscope standards, which should have a
red "X" below them:
- Myosin:
- B-galactosidase:
- BSA:
- Carbonic Anhydrase:
- Soybean Trypsin Inhibitor:
- Lysozyme:
- Aprotinin:
11/19/04:
As I stated above, I will be in most of this weekend and available for
giving help on the enzyme lab report. (Part of why I will be in as much as I
will be is that I am feeling guilty about not getting your protein labs back
to you as soon as I should have - I would otherwise be at, for instance,
a meeting of the
New Jersey Transhumanist Association
this Saturday.) Regarding question 5 and similar questions involving
Michaelis-Menton plots of substrate vs rate:
- I generally find it best to produce a linear-form graph first,
then use it to get estimates of the Vmax and Km before trying to fit
a nonlinear curve. The most accurate one is probably the Woolf (or,
to be precise, Hanes-Woolf) plot: see
Hanes-Woolf.gif, from http://opbs.okstate.edu/5753/Kinetics/hw_plot.html.
Note that "[A]" is referring to the substrate
concentration (e.g., the D-Alanine concentration - the same as [S]
in a more-helpfully-named plot such as for Michaelis-Menton) and
"V" is referring to the rate (e.g.,
(umoles pyruvate)/(minute*(ml stock enzyme)))
- Once you have estimates for the Vm and Kmax, you can use these
and SigmaPlot or Kalidagraph to get a nonlinear curve fit using the
Michaelis-Menton equation (v = ((Vmax*[S])/(Km + [S]))) with the
estimates used as initial values for Vmax and Km. This is rather
easier to show than describe, so I am not going to attempt to
describe the process (at least for now) - if you are uncertain how
to do this, you will need to get me (or - for SigmaPlot - Dr. Kahn,
or - for Kalidagraph - Dr. Chase) to show you how the first time.
Dr. Kahn and Dr. Chase both say that one should be able to get rough
estimates for Km and Vmax (good enough for using for initial values for a
nonlinear curve fitting) even without a linear-form plot, but I know that
I have problems doing this, and even they would need a linear plot
if the enzyme did not get near its Vmax (due to, say, inhibition or the
high-substrate-concentration points having to be removed due to problems
with them).
11/20/04:
One thing: Unless you've been told otherwise (usually because you're someone
who's working doing research in the building) or are just using the
computers (or the tables in 207!), do not work in the teaching labs without
someone around to supervise you - as in knowing you're there and being very
close by - me being down in my office not knowing you're there does not
qualify!
For how to get D-alanine concentration for number 5 and number 8, assuming
you used the pyruvate assay and varying amounts of 0.06 M DL-alanine: .03 M
D-alanine * ml of D-alanine used gives you amount of D-alanine in
millimoles, then divide by 1 ml (amount in total reaction mixture while
reaction is happening), giving you D-alanine concentration in molar. As it
turns out, it may be more helpful when working with D-alanine concentrations
to have them in millimolar (mM) units, so you may want to multiply these by
1000 and label your units accordingly. (Otherwise, one tends to get
graphs with 1E-04 and similarly harder-to-immediately-understand numbers, and
even smaller ones on the various plots like the Hanes-Woolf plot in which the
D-alanine concentration is divided by something.)
For how to get rate (v, units/ml, whatever) for a pyruvate
assay when you have too few points to use the slope method (e.g., when you
are varying something other than the amount of enzyme):
- Your pyruvate standard curve has an equation in terms of
y=mx+b, with y being Absorbance and x being micromoles of
pyruvate.
- To get micromoles of pyruvate formed from a given absorbance,
substitute the absorbance for y and solve for x (as in x =
((y-b)/m)).
- This is the amount formed per 10 minutes with whatever amount of
enzyme you used. To make it per 1 minute, divide by 10.
- To make it per 1 ml of stock enzyme, divide by the amount of
stock enzyme you used (as in, say, .1 ml at a 1:400
dilution would be .1/400 = 0.00025 ml; if you had 1 micromole
per minute formed per this amount of enzyme, you would divide 1
by .00025 to get 4000). (Equivalently, you could divide by the
amount of enzyme you used (e.g., if you used .1 ml of diluted
enzyme and you had 1 micromole per minute formed, .1/10 would
give you 10) and then multiply by the dilution factor (e.g., for
a 1:400 dilution factor, multiply 10 by 400 to get 4000 - again).
This gets you the rate in (umoles pyruvate formed)/(min * (ml stock
enzyme)), or units/ml.
You may find it useful to take a look at the larger website that I got the
Hanes-Woolf plot from: http://opbs.okstate.edu/5753/Enzymes.html.
It has some info on the Lineweaver-Burke, Michaelis-Menton, and other plots
used for determining Vmax, Km, Ki, etcetera. Note that it does have the
problem of using "A" as the symbol for the concentration of the
substrate, which is very confusing since A normally means absorbance.
I am not sure why Dr. Chase has asked you to do a Lineweaver-Burke plot for
experiment 8 when he allows the usage of a Hanes-Woolf or Eadie-Hofstee
plot for the linear plot required for experiment 5 (both a linear and a
nonlinear - Michaelis-Menton equation fitted - plot are required), the data
for which is supposed to be used in experiment 8. I will ask him tomorrow if
people can use another plot instead; he may say no, however, since if it
works (which I have not been consistently seeing in either experiment 5
or experiment 8) it is easier to see inhibition on a Lineweaver-Burke plot
than on a Hanes-Woolf plot.
11/23/04:
You do not need to turn in a disk with the enzyme lab - Dr.
Chase changed his mind on that. You will be required to do so for the
electrophoresis lab, however - more information will be provided on that
later on.
I will be in tonight until quite late - as in probably until 3AM or later.
If something is turned in to me prior to my going home or Dr. Chase coming
in tomorrow (or when he'd normally come in, given that tomorrow is
Thanksgiving), it's in today. I will likewise be in Thursday-Sunday,
although I will need some time for my own research, a seminar presentation
to prepare for for Monday, etcetera. If your enzyme lab is turned in
Wednesday or Thursday, it will be 1 point off (out of 100, and this is a
4-week lab...); if it is turned in Friday, Saturday, or Sunday, it will be
2 points off (as if it were 1 day late); if it is turned in Monday, as
Dr. Chase previously said, it will be 4 points off (as being 2 days late).
12/3/04:
I am sorry that I have missed various people over the past few days - my
sleep cycle has rotated such that I'm going to bed quite early and then
getting up between 2 and 6 AM. I will be in this weekend, but am trying to
get the protein labs graded; I will be available for quick questions
(unless I'm procrastinating, in which case feel free to bug me!). I have
figured out some things on how to interpret the files that UN-SCAN-IT
produces and will post these up after I go and get some food and sleep.
12/5/04:
Oops. Forgot to post up on UN-SCAN-IT; sorry! I would suspect that most
people are busily concentrating on the exam anyway, though...
See
below for a new version of the UN-SCAN-IT handout.
With regard to the files that UN-SCAN-IT produces:
- The files that it produces with each lane
(when you hit Save in the band-defining mode, after you hit
"Area"), are of two potential uses:
- I just realized this, so I'm not sure on it yet, but I
suspect that one could figure out where the end of the gel
is from them, provided that one had defined the lanes as
going all the way to the end of the gel, so either the
maximum or the minimum distance value (which I
believe is the first in each of the pairs) -
whichever is further from the dye front band - is the
distance to the end of the gel (on the picture).
- The numbers could be input into a graphing program like
SigmaPlot or Kalidagraph in order to get back a plot of the
distance along the gel vs the intensity of the bands at that
point - as in the curve with peaks for bands that you saw.
- The file that is saved at the end, when you hit "Save
Gel Data", is the most important one. This contains a table
(that you'll need to reformat by putting in some tabs) that is
essentially the same thing you saw at the bottom of the final screen
on UN-SCAN-IT. As the handout says, see the UN-SCAN-IT help menu for
info on what each thing on there means - the "centroid" is
probably most of use, to define where in a lane the band in question
was.
- The file that is produced when you save "Lane and Segment
Parameters" looks incomprehensible at first, but is actually
pretty simple. The first line with a number is the number of bands
(in all the lanes together), plus 1. (Why the plus 1? Good
question...). Each of the numbers after that is telling about the
location of a band ("segment" by the program's
definition); they are in groups of 4 numbers:
- The distance of the left side of the band from the
left-hand side of the gel picture
- The distance of the right side of the band from the
left-hand side of the gel picture
- The distance of the top of the band from the top of the
gel picture
- The distance of the bottom of the band from the top of
the gel picture
I have also come up with some revisions to the handout; I will put up a
revised version of the handout before Wednesday's lab if at all possible. A
quick summary of the changes:
- In regard to why you take multiple exposures, as well as the
things mentioned on there already, I am frequently seeing cases
where one or more lanes are very dark and other lanes are very
light. For these, as well as using the medium-exposure picture, you
will need to use the high-exposure picture for the dark lanes and
the low-exposure picture for the light lanes.
- Be forewarned that it is not very easy to correct mistakes with
this program if one goes on to the next step, and that the
"undo" button tends to undo rather more than one wants it
to.
- Don't use a part of the picture that is very bright because it
is off of the gel to set the brightness (as in typing in 0 in step 7);
use a part of the gel that doesn't appear to have anything at all on
it.
- The best place to choose for a part that's as dark as possible
is, for the gels, in the India Ink stains - if you want to use
UN-SCAN-IT on your blots, ask for advice if you're unsure.
- In step 8, instead of aligning to "Bottom", align
"Height". Moreover, one can also edit the numbers in the
table on the right by double-clicking on them.
- In case the idea above regarding how
one can use the files produced in step 9 doesn't work, I suggest
defining a fake band at the opposite end of the gel from your dye
front (the India Ink) - this should be a very narrow band with
minimal area (to avoid disturbing the calculations of percent area
any more than absolutely necessary).
12/7/04:
Due to that I haven't been given the isoelectric gel photos, the gel
electrophoresis lab is due at least two days from now for the Tuesday
lab. (It will be due 2 days after I put up the pictures on this website, or
- for the Wednesday lab - whenever it would normally be due, whichever
happens second.)
12/8/04:
Here is the new version of the UN-SCAN-IT
instructions:
A few things before the instructions:
- I wrote these in a hurry in-between answering questions and
while sleep-deprived. I'm rewriting them (somewhat) while I'm about
to fall asleep. I have no doubt that they have some places badly
needing clarification; sorry! Please let us know about any changes
that are needed.
- For purposes of moving files onto and of off the
(camera-connected) FotoDyne (and other lab) computer(s), which do
not have Internet access (allowing us to not bother updating them
much in regard to virus/spyware/etcetera protection, security
patches, etcetera), I have a couple of zip-disks courtesy of Peter
Anderson. (Do be sure to leave the room in 214 nice as a thank you
for him, for this and other things (like my being able to get calls
in 207); he's a very nice guy and quite willing to be helpful - so
much so that he's badly overworked!) UN-SCAN-IT is currently
installed not only on the FotoDyne computer but on all of the
computers in 214, likewise courtesy of Peter Anderson.
- I recommend taking at least two, preferably three different
exposures of your gels, at varying shutter times:
- An exposure that's "about right".
- An exposure that, if one clicks on "show saturation", has
red on it that almost overlaps with important stuff like
bands.
- An exposure that's about as much below, in time of
shutter opening, #1 as #2 is above #3. (The best "as much
below" may be in terms of subtracting exposure times or
in terms of an equal ratio of exposure times. I'm not
sure which is best yet, and it may vary depending on the
situation.)
(This is probably unclear. We want one "correct" exposure, one
underexposure, and one overexposure.) This will help you in three
ways:
- If one of your gel lanes is very dark, the bands on it on
the normal exposure are likely to be merged together, but
the high exposure may have more separation of the
bands. If one of your gel lanes is very light, the bands
on the low-exposure picture may be more visible.
- If one of them doesn't work well with UN-SCAN-IT for some
reason (what looks like a good exposure to human eyes may
not be so to a computer), you have backups.
- If given sufficient time, I can do some photomanipulation
on pictures, and my capabilities for doing so are rather
enhanced if I've got more than one exposure to work with
(see
http://www.wearcam.org
for some info as to how).
The images are, in general, saved under "Program
Files/Fotodyne/PC Image" (including under subdirectories of it).
- There is some photo-manipulation software on the FotoDyne
computer (the one with the camera hooked up to it), which can be
accessed by clicking on "PhotoIsland.com" on the desktop. (This
was a gift - a sharing of freeware, to be precise - by a student
last year, Michael Neu.) This is especially needed if your gel
(or blot or whatever) was turned the wrong way when scanning it.
- It is easiest to use UN-SCAN-IT if your dye front is at the
bottom of the picture and the top of the gel is at the top of the
picture. It is vital in order to use UN-SCAN-IT that the dye
front be either at the top or the bottom, and the top of the gel
at the other end, not to the left and right.
- You are required to get UN-SCAN-IT data on only your lanes (in
each gel, native and SDS) plus the standards. You are not
required to use UN-SCAN-IT on whatever lanes you are not
analyzing (as in the ones for the group that shared your gel) -
unless the other group does (a decent job of) UN-SCAN-IT on your
lanes on their gel, in which case you should do them the same
favor on your gel with their lanes.
Be forewarned that it is not very easy to correct mistakes with this program
if one goes on to the next step, and that the "undo" button, if available,
tends to undo rather more than one wants it to.
- Open UN-SCAN-IT via its icon on the desktop. I suggest Maximizing the
window at this point - the program was written for an earlier version of
Windoze and seems to have problems with its window being adjusted at
later points.
- Open the Digitize menu.
- Click on "Digitize Gel".
- Go up one directory level in the Open window, then click on "Fotodyne",
then on "PC Image", then on one of your images - try the medium exposure
one first. If you are uncertain about which image is yours, or which one
is the most usable exposure, check the "Preview Image" box in the Open
window, and select each of the images that you think might be yours. A
small version of the picture will appear at the bottom of the Open
window. Click on "Open" when you have selected the right gel.
- When the window pops up entitled "Gel Analysis Mode", select the top
left-hand picture, with the title above it of "Lane Analysis". (Or, if -
in the future - you are doing an ethidium bromide or fluorescent gel
picture, such that the bands are lighter than the background, select the
bottom left-hand picture.) Then click "OK".
- Next will pop up "Setup [Digitize Gel Lanes]". Your gel should have the
dye front at the bottom, and the settings should be on "Scan Top to
Bottom". If your gel has the dye front at the right or left, please
consult an instructor, unless you're familiar enough with photo
manipulation software to rotate it 90 degrees yourself. You can still use
(via clicking on "Scan Bottom to Top") a gel that has the dye front at
the top, but it may be trickier to figure out where the gel ends from the
scan (see below). Select "Calibrate Image Intensity", under "Optical
Density Calculation" select "Logarithmic (Film)" (as far as I can tell,
the response on a digital camera is more like film than like paper - it
is _known_ not to be linear), and "Normalize Lane Width to One
Pixel". "Automatic Lane Find" should be set to "Off" (it usually messes
up...). (Some of these defaults may already be correctly set, if
someone's been using the program before you for this.)
- Select a small area that is the palest area of your gel - something that
has no bands at all in or anywhere near it. Type "0" into the dialog box
that pops up ("Enter pixel calculation area") and click "OK". Then select
another area on your gel - usually the India Ink (dye front) if present,
or the darkest of your bands if the ink is not visible or is very light -
that is as dark as you can find. Type "255" into the dialog box that pops
up and click "OK". Then click on "Continue". When it asks you whether you
want to save a calibration file, click "No" - this is unlikely to be
useful, and you will have a number of files anyway!
- Next, you need to define the lanes. Click on the top-left point that the
lane needs to start at, then drag the area until it covers the entire
lane, including down to the bottom of the gel and up to the top of the
gel, but not including anything outside the gel; each of these areas
should start at the same top or have the same bottom (you can see the
former once you have a lane on the table on the right-hand side; the
latter can be figured out by the top + the total height from said table)
- ideally, both. If need be, feel free to adjust the top or bottom (or
sides) of a lane. Be sure to include the India Ink (if visible) and, if
at all possible, everything up to the end of the gel away from the dye
front. You can adjust the numbers in the table by double-clicking on
them. You can also make sure that everything is at the same top and/or
has the same height by going to the "Options" menu, clicking on "Align",
then on "Top" or "Height" and putting in an appropriate value. Write down
the numbers in the table on the right. Also define temporarily two
"lanes", along the top and the bottom of the gel (as in where you
measured from in the physical gel) and write down those numbers, then
delete the lanes so that the program doesn't try looking for bands in
them.
- Once you are satisfied with the lanes, click on the right bottom button
("Digitize") area of the window to go on to the next stage, defining the
bands. In general, you will wish to define any bands that you can see and
make sense of, including a band - as narrowly defined as possible - for the
dye front. If you can see a band, or a possible band, on the gel picture,
and there's a "shoulder" on a peak that's at the right position to represent
that band, then split the peak up into 2 bands - one for the shoulder and
one for the central peak. (You may need to divide things up further from
this point, of course!) The bands will have lines across them for the
background (what is subtracted from the height of the points before showing
some of the statistics); I suggest having these be approximately straight
across, except for the dye front or if this lane is the standards, unless
you have a weird-looking gel that demands considering some areas to have a
higher background level than others. (You can adjust these by clicking on
them and dragging.) The overall background level should be (for a normal
lane/band, not something like the standards) at about the level of the
lowest base of a peak/possible peak - as in at about the maximum height of
the curve in areas that you are pretty sure do not have a band in
them. Adjusting the background level points also adjusts where the peak
begins and ends, or you can click on the horizontal parts of the rectangles
showing the peak locations in the image in the upper right hand corner. The
background level for the standards and dye front should be very high - first
narrow the area of the peak down to include only what you are pretty sure is
the peak (or to the darkest area of the band, if possible), then raise the
background level until both ends of it intersect the peak trace. To add a
peak, click on "Add Peak" then below the peak tip you want, on the
approximate level of the background you want. To remove a peak, click on
"Del Peak" then double-click on the peak you want to remove. You may
need/want to add an extra "band" for the top and/or bottom of the gel -
definitely do this for the standards, and do it for any other lane for which
the top or bottom may differ significantly from the standard lane due to
ragged edges or curving or something. If so, make it as narrow and the
background as high-up as possible. When you are reasonably comfortable with
the results, click on "Area", then on Save to save the data (in the form of
a text file (use WordPad to open it; don't allow Windoze to use its "web
service" to figure out how to open the file) which has one column of the
distances and the other (right-hand) column with the darkness of the lane at
that distance - I suggest using a .txt or .tab ending, and make sure to
include in the filename which lane this is), then on "OK" to go onto the
next lane. (Sometimes the program is a bit stubborn about not recognizing
that you're clicking on the end of one of the background/peak lines; this
seems to especially happen when the background line is very slanted. Try
clicking on the top end of the line and bringing it down a bit,
then bring the bottom end up and adjust the top end back to where
you want it.)
- After you define the bands on the last lane, the next screen allows you
to see how the bands are on the entire gel picture, plus giving a lot of
the numbers you will be interested in for your lab report. Go to the
Options menu and click on "Save Gel Data"; you will get a "Save Options"
window, for which you should make sure everything is checked off (Xed)
except "Mol. Weight" (since you haven't told it what the molecular
weights are, this would not have anything sensible in it) and anything
with a % in its name (since these would be distorted by the dye front et
al anyway, and have to be recalculated). Save this
file. (It should have a .txt or .tab ending, and is openable with any
text editor (e.g., NotePad or WordPad), although the formatting may look
rather screwy (tabs don't tend to translate well).) You should also
click on "Save Segment Parameters" and save those, although that file is
harder to interpret (see below). Use a different filename than for
anything else you saved, for both this and the "Gel Data" save!
- For information inside the program on what the various columns mean in
the table produced in "Save Gel Data" (also visible on the bottom of the
window), open the "Help" menu then click on "Digitized Data
Definitions". The middle of the band (in the up/down/Y direction) is
supposedly to be found in the location of the "centroid", which is
indicated by the dashed purple lines. For the "Segment Parameters", the
format of the file is as follows:
- The first number in the file is the number of bands plus 1. (Why
plus one? Good question...)
- After the first line with a number, the numbers are in groups of
4:
- The distance of the left side of the band from the
left-hand side of the gel picture
- The distance of the right side of the band from the
left-hand side of the gel picture
- The distance of the top of the band from the top of the
gel picture
- The distance of the bottom of the band from the top of
the gel picture
I suggest saving a picture at this point, and printing it out
from inside UN-SCAN-IT as well. For one thing, such a picture - with
bands marked on it - qualifies for the required picture to go in your
lab report. For another thing, it helps in interpreting the numbers that
you get from UN-SCAN-IT.
- If these results - either the tables or the picture - do not look right,
then you may want to save what you've got, then try some lanes over
again and/or try using a different exposure gel if you have more than
one. I am afraid that most ways of using the previous results to skip
some steps in the program either aren't available or are more trouble
than they're worth. But keep in mind that you don't need to re-UN-SCAN
lanes that you didn't have any problems with.
If you did not write down the positions of the top and bottom of the gel in
step 8, probably due to using the earlier version of these instructions, we
can probably reconstruct this information from some of the files that you
were instructed to save - print all of the "Gel Data" and
"Segment Parameters" files, plus the first and last pages of each of the
files that you saved for each lane, and bring them to me.
12/9/04:
I now have the IEF gel data from the Tuesday lab, as
PostScript files (one or the other or both of the below should work; be
forewarned that they are quite large and the file may take a while to load
and display):
See below for the Wednesday IEF data. See
below for new versions if the Tuesday (or Wednesday)
files do not come out properly.
My apologies to anyone who was looking for me today; I was here until after
8AM, then went home and collapsed. I will be in tonight until sometime
between 4-8 tomorrow morning, then again on Friday and probably Saturday and
Sunday.
In regard to which standards to use, I currently suggest using both
the prestained and the non-prestained (the second being the ones that only
show up with Coomassie staining; calling them "unstained" is
confusing...) standards - if the relationship with them between Rm and
log(molecular weight) is similar enough, you can plot log(molecular weight)
(on the Y axis is most convenient) vs Rm on the same graph. You should also
be able to plot on the same graph log(molecular weight) vs Rms gotten from
the distances derived from UN-SCAN-IT (as well as those you manually
measured) - come talk to me if the Rms are very different. (Also: I
frequently find that comparing the gel and the blot via cm of distance
doesn't work, and that instead one needs to calculate Rms for the distances
on the blot (including via UN-SCAN-IT, if there are too many bands to
measure accurately by hand, which is frequently the case) and compare those
to the Rms for the gel. This is always necessary in order to
compare blot-visible bands to gel-visible bands analyzed using UN-SCAN-IT, or
vice-versa - UN-SCAN-IT's units are only proportional to physical gel
distances (or physical blot distances), and that proportion changes
depending on how much the picture is zoomed, etcetera.)
Another wording thing in the lab manual that may be confusing people with
UN-SCAN-IT: "area" in the lab manual with regard to the
densitometer or UN-SCAN-IT results is generally referring to the area under
the curve - which in UN-SCAN-IT comes out as the "Pix Total*" (with
subtracting background) or "Pixel Total" (without subtracting
background). This is not the same thing as the
"Total Area", which is simply the size of the area that you
defined the band as being within (and is not all that important).
I now have the IEF gel data from the Wednesday lab, as
PostScript files (one or the other or both of the below should work; be
forewarned that they are quite large and the file may take a while to load
and display):
The Tuesday lab is now due Monday (unless Dr. Chase overrides me); the
Wednesday lab is due Wednesday, as he stated previously. See
below for new versions if these do not come out
properly.
12/11/04:
I will be in today starting sometime between 2-4PM. I will be sleeping
before then on a couch in 325; disturb me only if I have overslept (it's
after 4PM) or if you need to get a key from me (I will not be any
shape/mood to answer questions...) - the zipdisks are in my office between
the monitor and the keyboard. I should be available to answer questions
around 4:30-4:45PM, and may be able to answer simple questions by 4PM or so
(I take a while to wake up - medication has to have time to kick in, for one
thing).
Note that you will need to turn the questions in on disk, unless you can
email them to me in plain text - if you try this, do it ahead of
when you turn the rest of the lab in, and check with me to make sure it went
through properly. If you are at all uncertain what I mean when I write
plain text, do not try this - turn it in on disk.
I am finding with UN-SCAN-IT that it is inadvisable to try resizing the
screen it gives you - this either doesn't work at all or results in your not
being able to print the entire picture at the end (it only prints a small
section of it).
I have been seeing some difficulties in loading pictures into UN-SCAN-IT in
a couple of computers, namely the Fotodyne and the first one on the right in
214; I will be consulting with Peter Anderson on Monday about this, and am
hoping that this will not happen with any more computers.
With regard to the SDS Gel Report section (page 30), the sections are
unfortunately out of order in regard to how it is most logical to go about
them, and some data and analysis is required for these steps that is not
directly mentioned; you do need to show said data and analysis. Feel free to
arrange your report either in the order found in the lab manual or in
the order that it makes sense to do the lab report (2, 1, 5/6, 9, 8, 3, 7,
4); I have written the below in the order that is in the lab manual for ease
of comparing between it and the lab manual.
- You may give a printout/photocopy with the bands outlined, or
an UN-SCAN-IT screen image printout, instead of a drawing. You do
not need to put on the picture the names and molecular weights of
the standards, provided this information is in a table.
- The amounts of proteins applied for the table are determined as
follows:
- The amount of solution (sample or standard) that you
added to the lane in question
- For the sample lanes, how much protein this contained,
based on your protein concentrations (from the enzyme lab,
as corrected by Dr. Chase if applicable)
You should list on this table not only the distances for the final
enzyme bands (and the standards), but any distances you measured for
the dialyzed enzyme bands. If the top of the gel or the dye front is
in a different position for the dialyzed enzyme lane, you need to
calculate the Rms for the bands in the dialyzed enzyme lane;
otherwise, the important ones should be the same as for the final
enzyme lane. You do not need to give the amounts of sample applied
for the samples of the other group, unless your lane(s) did not work
and you are using their lane(s) instead, in which case you should
put in the amount of sample applied (and amount of protein in said
sample) if at all possible.
- The graph of Rm vs Log(Molecular Weight) should include, if they
fit together and give a reasonable (e.g., negative slope) line, Rms
from your hand measurements of the non-prestained standards, your
hand measurements of the prestained standards (note the colors in a
table somewhere) from the SDS gel if any, your hand measurements of
the prestained standards on the blot if any (again, note the colors
in a table somewhere), your UN-SCAN-IT measurements converted to Rms
for the Coomassie-stained SDS gel, and your UN-SCAN-IT measurements
of the prestained standards on the blot if any. (Remember that any
numbers that you plot, you need to also give, and give the source of
(as in distances that were converted into Rms and MWs that were
converted into log(MWs)).) These should all go on the same axes (X
for Rm, Y for log(MW) is preferable), not seperate axes or - in
whatever computer program you are using - more than two columns (one
per axis). (If not all of these fit reasonably on the same graph,
something is wrong; please consult me as to what the problem is. The
most likely explanations are:
- You didn't figure out the Rms correctly from the
UN-SCAN-IT data and/or
- You are getting a sigmoid curve because the standards at
the beginning and end didn't run quite right, in which case
some of them will need to be removed - not any that are in
the range of your Rms for the sample bands that might be the
D-amino-acid-oxidase, however!)
This graph can be done on Excel or essentially any other graphing
program that I know of, and unless you are doing it by hand
on semilog paper for some reason, you need to give the equation for
going from Rm to log(MW) - preferably in the form log(MW) = slope*Rm
y-intercept, so it is preferable if you plot this with Rm on the X
axis and log(MW) on the Y axis (do not plot it with a log scale on
the Y axis unless you are using semilog paper; take the molecular
weights, take their logs, and use those numbers as the Y values);
you should give the R-squared value, standard errors, etcetera for
this equation. You do not need to plot the position of the
D-amino-acid oxidase band on this graph unless you are graphing the
points (and thus drawing the line without an equation) by
hand. Instead, you should take the Rms that you think may be
your D-amino-acid-oxidase band (with the sources of these Rms
being all of the measurements available - i.e., hand
measurements of the SDS gel, UN-SCAN-IT measurements of the SDS gel,
and hand or UN-SCAN-IT or both measurements of the antibody-stained
blot), plug them into the equation of the line, get the result
in log(MW), take the antilog (if you used a log-base-10
("log" in many programs/calculators), 10 to the result; if
you used log-base-e ("ln" in many programs/calculators),
use e to the result ("exp" in many
programs/calculators)) to get the molecular weight, then
figure out which one or ones represents the D-amino-acid-oxidase
band (see next step).
- In order to figure out what band is the D-amino-acid-oxidase
band, you need to do the following:
- Examine what bands showed up with a larger percentage of
the total absorbance (calculated via UN-SCAN-IT using
the "Pix Total*") on the
final enzyme lane vs the dialyzed enzyme lane or that
simply did not show up on the dialyzed enzyme lane but did
in the final enzyme lane. These bands are possibilities for
being the D-amino-acid-oxidase band.
- Examine what bands showed up on your antibody blot,
which hopefully should number among them ones which
correspond (worked out via cms of distance if you're lucky,
but more likely Rms) to the bands which showed up in your
final enzyme lane (and should have increased, or at least
remained the same, between your dialyzed enzyme lane and
your final enzyme lane).
- Take the Rms for each of the bands which you conclude
may be your D-amino-acid-oxidase band and plug them into the
equation of your standard curve, as above. If you have more
than one band that may be the D-amino-acid-oxidase, the one
that is closest to the literature value (see the enzyme lab)
should be selected (yes, this is "cheating", but
at this point...); if you only have one, that's your
D-amino-acid-oxidase band.
- I do not expect you to print out and turn in a copy of each of
the lanes from UN-SCAN-IT, given how difficult getting it to print
the curves for each lane is. The data that you get from the "gel
data" plus a printout of the picture it shows at the end is
sufficient; adding information on the dimensions of each band (the
"segment paramenters" or the equivalent table at the
upper-right-hand of the final UN-SCAN-IT screen), on the top and
bottom of the lanes used (either from the upper-right-hand table of
the screen for defining lanes, or deduced from the x-y data saved
for each lane (after hitting "Area" then "Save")), etcetera are
preferred (as in possible extra credit) but not required unless they
are necessary for interpreting your results (e.g., to show how
you/we figured out where the top of the gel is).
- The integration results should include the %age
areas of the "Pix Total*" for the
final enzyme and dialyzed enzyme lanes (if your dialyzed enzyme lane
is too blurry/complicated/whatever for you to make sense out of
manually, that does not mean that it cannot be done by the computer
ask me for assistance if necessary), so that you can answer 7 and
can distinguish which bands may be your D-amino-acid-oxidase
bands. (You do not need to give this for the standards, and it
should not include the India Ink or other non-sample bands.) For the
standards and final enzyme, plus your dialyzed enzyme if there is
any doubt which bands on it correspond, this table should also
include Rms, plus information on which band was your dye front and
on what your gel top distance was. The distances from UN-SCAN-IT are
not in any particular units, so don't worry about the units for
them; they are to be used in relative measurements such as Rm, given
that they will be affected by whatever zooming was done with the
camera, how UN-SCAN-IT reads the file, etcetera.
- To compare the percentages with your specific activity:
- Take the percentage in the final enzyme lane in your
D-amino-acid-oxidase band, divide this by the percentage in
the dialyzed enzyme lane in your D-amino-acid-oxidase band,
and write the result down.
- Take the specific activity in your final enzyme (from
the purification table in the enzyme lab, as corrected by
Dr. Chase if applicable), divide this by the specific
activity in your dialyzed enzyme (again, from the enzyme
lab), and write this down.
Do these numbers look similar? If not, what has caused the
difference? (If your D-amino-acid-oxidase band did not show up
in your dialyzed enzyme lane, then you obviously do not take the
ratio (you cannot take one with a denominator of 0!). Examine
whether your D-amino-acid-oxidase band may be buried inside one of
the other bands in your dialyzed enzyme lane.)
- You can use either a drawing of the blot or a photograph of the
blot, provided the latter has indicated on it what bands you
measured, including via UN-SCAN-IT (in other words, if you analyze
your blot via UN-SCAN-IT, you can print out the picture with the
boxes around the bands that it gives you and turn that in as the
blot drawing/picture).
- You will only be able to figure out what bands in your blot
correspond to what bands in your gel by the cm of distance if you
are lucky. In most of the cases I have seen, these do not correspond
very well, because the blot stretches (or shrinks due to drying) or
the gel squishes or both or for other reasons. I find it is
generally less trouble just to go to the Rms immediately without
trying to make the cms correspond. You will have to work out the Rms
in any case for any visible (prestained) standards on the blot (for
use in the graph), and you also must work out the Rms for whatever
bands you think may be the D-amino-acid-oxidase bands (for use in
molecular weight determination).
For the native gel:
- You do not need to turn in a drawing; you can instead turn in a
picture if you mark on there where you are measuring bands to
(including if you use UN-SCAN-IT, in which case it is preferable if
you print out the final picture it gives, since that has already
labeled which bands are which).
- Again, for the blot you do not need to do any drawings if you do
a picture. Do not worry too much for this or for the activity gel
drawing if your standards do not show up - for the native gel, they
are generally more for telling whether things ran right than
anything else. The only exception to this is if the Rms (see below)
for your activity bands and your antibody-recognized bands do not
seem to correspond very well, in which case the standards, if
visible, may help us tell what the cause of the difference is (e.g.,
something stretching or shifting).
- Again, you will only be able to get corresponding distances
between the gel and the blot if you are lucky. Rms are probably
going to be necessary to compare the two adequately.
You are not required to plot log(MW) vs Rm for the prestained standards in
the native gel. (See question number 3 for why not.) If you wish to do so,
feel free, and I will be interested in what you get and may give some extra
credit, provided you get the lab report in on time - but be sure not to plot
these on the same graph as for the SDS gel! Similarly, do not try plugging
in the Rm for the final enzyme band on the native gel or blot into the
equation gotten from the SDS gel - it will not give you any results that
make sense. To try this, you will need to plot the prestained standard
log(MW)s vs their Rms, get the equation of this line if it turns out to be a
line (I have my doubts as to whether it will), and plug the Rm value(s) from
the native gel and blot into it. Again, this is not required, and
please do not turn in the lab report late if you do this.
For the questions, the most important word in the second part in number 5 is
"two" - as in why not one antibody (or, as in our case, one
collection of polyclonal antibodies which attach to the enzyme). See pages 9
(bottom) and 10.
I have discovered some ways that may make it easier for you to do UN-SCAN-IT
scans if you need to do another one, such as if you left off some needed
information from the first time you tried it. For instance, it is preferable
to not include the dye front (India Ink) in the lanes that one defines for
one's samples - one should instead define a seperate "lane" for
just the India Ink blots. That way, one does not have to worry about the
contribution of the India Ink to the "Pix Total*" As another
instance, if you have some very faint bands, such as the standards on either
blot or the native gel, be sure that you select the bright area for
calibration as something lighter than these! You also should keep in mind
that it may be advisable to use another exposure than the "medium"
one - for a very dark, crowded lane, such as most people's dialyzed enzymes
for the SDS, the "high" exposure is likely to be more useful; for
a very faint lane, the "low" exposure is likely to be more
useful.
For future reference or if you are photographing your blot (probably again)
at this point, I have found that blots can be photographed in a variety of
ways, and it depends on the blot what works the best. If you can see the
most on your blot by holding it up to the light, then use
transillumination. If not, then try direct illumination first. You should
also experiment with what filter works the best - I have sometimes found
that the Ethidium Bromide filter works the best, I have sometimes found that
the Coomassie Blue filter works the best, I have sometimes found that
unfiltered works the best (in approximate order of likelihood).
In regard to the IEF gel pictures, if you have problems
getting your computer to handle them, please let me know and I will
try to put up another version - I am much more limited in this than
I would be for an image file, however (they are in PostScript). In regard to
distinguishing where the anode is, it should be a faint white or dark line
up near the top of the gel; ask me if uncertain.
OK, here are new versions of the IEF gel images,
including ones in PDF format (thanks to
GSview); you should be
able to view either the postscript or PDF versions - if not, let me know:
12/12/04:
I am hearing some confusion on the IEF gel information. People seem to be
thinking that the numbers that Gavin put on there for the standards are
distances. They are not. They are isoelectric points (pIs). You measure the
distances from the screen or from a printout, of both the standards and your
sample band(s); you can then (at your option) divide by the distance between
the anode and the cathode (use the bottom of the gel - making sure that
you allow for any tilt in the picture - if you can't find the line of the
cathode) to get an Rm - you do need to do this if you measure some of
the bands on a printout and some of the bands on the screen or something
like that (i.e., if you do it at different scales). Then do one of
the following:
- As the lab manual currently says, plot by hand distance or Rm on
the Y axis and pI on the X axis, draw a line through these, plot the
distance or Rm of your sample band(s), and thus determine a pI.
- As I would do, use a computer to plot distance or Rm on the X
axis and pI on the Y axis. You then get the equation of this line
and plug in the distance(s) or Rm(s) (whichever you used to create the
line) into the equation of this line to get the pI of your sample
band(s).
12/13/04:
Do NOT use the prestained ("stained") standards from the
lab manual, only the non-prestained ("unstained")
standards. I will be asking Dr. Chase to remove the numbers for the
prestained standards from the lab manual, since they change with each batch
of prestained standards and having the numbers in the lab manual confuses
people. Look on Emilia's door or above for their
molecular weights.
I am seeing some people making the distinct mistake of getting
"measurements" from UN-SCAN-IT via printing out the picture one
gets at the end and measuring it, instead of using the tables and data it
produces. Such "measurements" can only be used as a substitute for
physical gel measurements if you forgot to do those. You must use
the UN-SCAN-IT "Y centroid" (and other) data in order to get Rms
from UN-SCAN-IT.
Another mistake that people are frequently making is to try to plot the
various standards on the same graph but with multiple lines, multiple
Y-axes, or whatever. Do not do this. In the graphing program, there should
be two columns of numbers - one column of Rms, one column of log molecular
weights - plotted against each other. The points should all go on the same
line (approximately) - if they don't, this is a sign of something being
wrong.
A third mistake that people are making is to think that the Segment Area and
Segment Area% printed out by UN-SCAN-IT are the areas that the lab manual
talks about. They are not. They are simply the areas of the bands
that you defined. (Give the Segment Areas in your report; you need not
bother giving the Segment Area%s.) The "areas" that the lab manual
talks about are the areas under the curve - the total absorbance. These are
given by the Pix Total* in the UN-SCAN-IT table.
12/15/04:
I am in and will be available for assistance until the General Biochem exam
tomorrow, which I will be helping proctor. After the exam, I will be going
to bed until approximately 5 or 6 PM. I will be available again for
assistance after that.
12/16/04:
Info on the experimental biochemistry exam:
- Location (from Dr. Chase): Ruth Adams Building 001 (i.e. large
classroom in the lowest level.) It is down the lane on
the Douglass campus that has the Chemistry Building
near the top; it's on the right.
- Time: Monday, Dec 20th, 8AM.
My apologies about misremembering it as Ruth Adams 014/016. I will try to
remember to put a sign on the door of 014/016 directing people to the right
place.
I will be in tonight until, well, tomorrow, although there is quite a bit of
grading that I need to get done. I will be in again tomorrow around 5 or 6
PM.
12/17/04:
Sigh..., well, it turned out to be more like 2PM or later that I got to bed,
and thus wasn't up until 8-8:30PM. My apologies to anyone looking for me. I
will be here over the entire weekend (except when going out to get something
to eat or things like that), sleeping in room 325. I will probably get to
sleep sometime around noon tomorrow and intend to sleep until 8PM or so - if
I am asleep any later than that, please feel free to pound on the door of
325. (Before then is inadvisable except in emergencies or to get
keys or something like that...)
12/22/04:
For anyone wondering about their grades, I didn't actually get the last of
the electrophoresis labs until Monday night, and moreover spent about 10 hours
Tuesday in revising the grading master (to take into account UN-SCAN-IT,
my webpage's instructions, etcetera). We are hoping to have them
all in by Thursday, via all three of us (Dr. Chase, Laura, and myself)
working on them with my providing guidance on what I was telling people and
on various headaches with UN-SCAN-IT. Happy holidays!
12/26/04:
Well, it wasn't possible to get them in by Thursday. Sorry! I had to spend
another 8 hours or so revising the grading master further to take into
account findings on grading a couple of sample lab reports. One thing: I
have not gotten electronic copies of the answers to the questions from quite
a few people; please check your email to see if you are among them!
Again, happy holidays, and I hope that, if you have family or friends in
Southeast Asia, they were not hurt by the earthquake and resulting tsunami
this morning!
12/28/04:
I am leaving today and will be back (TAing Tuesday again, as usual) January
14th-15th. If you could not get the electronic copy of the answers to the
questions to me by last night or if I reply this morning, then
please send them to both Dr. Chase and Laura.
The grades on the electrophoresis labs were... variable. Quite a few people
left out large chunks of their reports, from what I could see, and as a
result got marked down quite a few points. OTOH, quite a few people did lots
more than was actually required and thus got a considerable amount of extra
credit. The grading master wound up being ~10-12 pages long, BTW...
1/18/05:
Welcome back! The following is a listing of some possible lipid sources if
you choose to do the lipid lab (ask Dr. Chase for suggestions for the
carotenoid lab; note that we prefer to have about equal numbers of groups
doing each). I have nutritional information, including proportions of weight
of material vs saturated/polyunsaturated/monounsaturated fat content, on all
of them.
- Cashews, Roasted
- Pine Nuts (Pignolia), Dried
- Coconut, Sweet, Shredded and Dried
- Walnut, Black
- Brazilnuts, Dried
- Filberts/Hazelnuts, Dried
- Caraway Seed - not sure about this one
- Spirulina Seaweed, Dried - This one is likely to turn out
somewhat odd lipids, being a cyanobacterium (blue-green alga),
although this actually does mean that Dr. Haggbloom's GC's
predictions of oddball lipids with it would probably be accurate! It
might also be a source of carotenoids, although different ones than
Dr. Chase has worked with (or has readily available references on)
previously, but he would certainly be able to tell you where to look
for information about this source.
Note that on the "roasted" ones that you should avoid
oil roasted nuts (or whatever), since you wouldn't know whether the
lipids were from the nuts/whatever or from the roasting oil.
2/23/05:
This is a reconstruct from a backup - I did a typo! Some material was lost,
unfortunately, but the most important part, I have hopefully reconstructed
below. If anyone has a more recent version saved someplace, I'd appreciate
it...
The results from the tuesday test gel are below:
Here are the lanes (from top to bottom):
- Blank (top lane)
- Blank
- KG - needs to be done over again
- CEMB - needs to be done over again
- NTH
- PD - probably usable
- LPK
- AK
- Blank
- Blank (bottom lane)
The wells are at the left; the glowing bands in the middle are the plasmids;
the glowing blob to the right is RNA. The bands are rather distorted due to
running at 180-200 volts (in a 0.8% agarose gel, in a refrigerator, but it
still heated up appreciably!).
2/25/05:
Due to that y'all only got back the HPLC and GC data this past Tues/Wed, and
that I won't be very available this weekend for helping with the GC data,
the labs are now due on the 8th/9th (Tues/Wed) of March (1 week after they
are normally due). This does mean that we won't be able to send out
the normal warnings if someone is having major problems and needs to be
notified in time to drop...
3/6/05:
Yes, I'm here. I am currently about to go upstairs and take a nap in room
325 - probably for about 4 hours (don't wake me before 5 PM, please!). I
will be available to help with the lipid labs (and, to a lesser degree, the
carotenoid labs) this evening and Monday evening. I will try to put up the
gel pictures from Tuesday's lab before Tuesday, and may try to put up the
gel pictures from Wednesday's lab before Wednesday.
OK, I'm awake (have been for a while, and some people are here). One
question that is coming up a lot is about how to figure out the
concentration of phosphate/phospholipid using the phosphate analysis. The
instructions on the bottom of page 10 in the lipid lab manual are, I am
afraid, not very clear - they appear to be assuming the use of only one
sample, which wouldn't work very well. What I would advise doing:
- Plot the absorbance (on the Y axis) vs the umoles of phosphate
in the standard (on the X axis), including a 0,0 point, and get a
slope, which is in (Abs/umoles). (Actually, absorbance is unitless,
but saying it's in (/umoles) wouldn't make much sense...)
- On a second graph, plot the absorbance (on the Y axis) vs the ul
of sample used (on the X axis), again including a 0,0 point, and get
a slope, which is (Abs/ul).
- Divide the slope of the graph of the samples by the slope of the
graph of the standards to get umoles/ul (the umoles and ul switch
places due to both being in the denominator of their respective
fractions).
- To figure out how many umoles of phosphate were in your original
phospholipid extract from the acetone precipitation, multiply the
concentration from above by the number of ul you dissolved the
phospholipid extract in.
- To figure out mg from umoles, multiply by 789 (molecular weight)
to convert to ug, then divide by 1000 to convert to mg.
- To figure out proportion of phospholipid from the acetone
precipitation that actually was phospholipid, divide the mg from the
previous step by the number of mg of "phospholipid" you got from the
acetone precipitation; then convert to percentage by multiplying by
100.
- To figure out what proportion of total lipid was actually
phospholipid, take the previous result and multiply by ((phospholipid
mg from acetone precipitation)/(total lipid mg used for acetone
precipitation)). By "previous result", I am referring to the
result from number 6.
Tuesday lab people: Don't forget prehybridization tomorrow! Same for
Wednesday lab people, who need to do it on Tuesday.
3/8/05:
Here are the image files of the plasmid gels for Tuesday; sorry, but I
haven't had time to work on combining the different exposures yet (this is
not a trivial procedure!). I have expanded the contrasts on the
below, so they should be at least slightly better than the originals (some
further contrast expansion may be possible later, BTW).
- AK:
- CEM:
- DKPL:
- KG:
- LPK:
- NTH:
The Standards:
The brightest band should be the 1636 band; the 506/517 band should be the
second-brightest after that, unless it's covered over by the dye marker.
The due date for the Lipid and Carotenoid labs is now Wednesday, 3/9/05, for
the Tuesday section, and Thursday, 3/10/05, for the Wednesday section, due
to the snowstorm. The due date for the plasmid labs is 3/29/05 for the
Tuesday section, and 3/30/05 for the Wednesday section - in other words, one
week from the next lab meeting after spring break. Note that this does
not mean that Spring Break time won't be counted as late time for
the Lipid and Carotenoid labs! (I'll be here over spring break to hand
things in to, and I suspect Dr. Chase and/or Laura will be also. Ask
Dr. Chase for how Spring Break time will be counted.)
3/10/05:
One mistake I hear people making on the Lipid labs is in regard to the table
from the GC data and the percentages. Don't just copy the percentages that
are on the printout! Those include peaks that we've concluded aren't really
there (blips that show up as some weird fatty acid found only in bacteria,
for instance). Add up all the areas for the lipids that you consider to be
"real"; this is the total area. For each lipid you put in your GC table,
take its area, divide by the total area, and multiply by 100 to get the
percent it is of the total area. (I've been telling people this when I got
asked; sorry I didn't put it up here earlier, but I have been distinctly
lacking in time... likewise, sorry for not having the Wednesday gel pictures
up yet, but I haven't had time to do the transfer of data.)
3/22/05:
The plasmid lab is now due Friday, April 1 (no, not an April Fool's
joke...), which means that you can turn it in anytime until whenever I leave
or Dr. Chase gets here (whichever happens first) on the morning of Monday,
April 4th and have it not be late. I will not be available for
assistance with it on, at minimum, Friday, April 1 or Saturday, April 2, and
will not be here on Saturday, April 2nd. (I have a presentation on
Saturday, April 2nd, and thus wouldn't be able to start grading anyway, so
that's the major reason its due date has been pushed back.) I will be
available for assistance on Sunday, April 3rd, and will try to make as much
time as I can before April 1st, but can't guarantee anything - sorry!
In regard to other requirements for the plasmid lab:
- You need to turn in a disk with your answers to the questions in
the plasmid lab on it, which will be uploaded to
turnitin.com. Remember that questions are to be done independently
(of other students), and that if you use any sources other than
Dr. Chase, Laura, myself, or the lecture course (including its
textbook), you need to cite them appropriately. Please don't include
the text of the questions in what you put on the disk, BTW! The name
of the file on the disk should include your name. (If I still have
your disk from last time, come by and pick it up from me.)
- You do not need to do a rewrite
of the lab manual in giving a description of the procedure - I don't
want to read 35 copies of the lab manual! Give me:
- All numbers that change (measurements or amounts added,
for instance)
- Anything done differently from the lab manual (even if
we told you to do it differently, note down that it was
different (and why))
- Anything that you noticed during the procedure
- Anything that went wrong
I do not want an outline of the procedure except as necessary to
give the above.
3/28/05:
In regard to the writeup for the plasmid lab:
- The material on page 26 is rather more up-to-date in terms of
what is necessary/desired for the tables et al than is the writeup
section itself.
- You do not need to turn in both a drawing and a picture of the
gel or blot; for each, either a drawing or a picture with the bands
et al clearly labeled is fine. Instead of putting much more
information on the drawing or picture, you can simply number the
lanes and give the other information (e.g., amounts used) in a
table.
- Part 6 in the section on the Report: Instead of locating each of
your fragments on the plot and thus figuring out its size, you can
use the equation of the line - plot log(bp) as Y and Rm as X, so
that you can plug in the Rms for your fragments and plasmid sizes
into the equation for X, get Y, and take the antilog to get the size
in bp. The fragments and the plasmid sizes are treated the same way
in this.
- You will probably need the sizes (in bp) for both the gel and
the blot to do the restriction map, unless you had lots of problems
with the gel or with the blot so the other is more reliable.
Incidentally, while it is technically incorrect, the number of base pairs
(bp) is frequently termed the "molecular weight" (or the "size").
3/29/05:
We have delayed the due date of the plasmid lab again, namely to next
Tuesday/Wednesday (depending on your section). This is mainly because I will
not be available on Friday or Saturday (if I come in Saturday evening after
the conference I'm presenting at that morning, it will be only briefly - I
will have had to get up before 8AM to go to the conference - and I'll be
working on the presentation and paper I have due Monday) and will have
limited availability on Sunday.
The RNA results today were, well, mixed. I suspect all the groups got
something - as in not-chewed-up RNA - but the buffer we were mixing
with the samples turned out to not have enough ethidium bromide (EtBr) in
it, so the results were very dim, especially the non-standard lanes. (For
future note: EtBr is very unstable, particularly with light and particularly
when not kept cold. We were shipped this buffer as a gift from a company,
and it apparently didn't arrive frozen and wasn't in completely covered
tubes (they may have thought the dye that's in it would keep the EtBr
intact, but it doesn't seem to have).) Soaking the gels in an EtBr solution
(1 ug per ml) didn't help - it just increased the background and/or spread
out the bands. Most people will wind up needing to
use the below, a
picture of a gel of previous results (to be precise, by Rosa, a past student
of Dr. Chase's). This picture is available as:
(in the appropriate file format for the names; the .tif one is the
highest-quality, but is also the largest-size and is not as portable as some
of the other formats). Going from left to right, the first lane is the
standards (see below); the second lane is RNA from
another plant; the third lane is how the cabbage leaves you worked with
should have turned out; and the fourth lane is from E. coli
RNA. The (unfortunately faint) black rectangles close to the top, with thin
bright lines right below them in some cases, are the wells. Note that if you
use this gel, you will need to do either a by-hand curve fitting for the
standards, or use the equation given in the lab manual or
below, and moreover should use the
E. coli rRNA sizes as additional standard bands.
Here are the RNA standards if you use Rosa's
gel - they are not the same standards as for the gels
this year:
Please note that the top two bands on these standards (9.49 and 7.46 kb) are
merged together into one band on Rosa's gel; use the lower of these sizes
for the top standards band on Rosa's gel. Look on the copy of the
picture in the RNA lab manual for a more clear explanation of the standards.
As mentioned in the lab manual, a good (IMO - I created it (with some
inspiration from Dr. Chase), so I'm biased!)
equation for fitting the RNA standards (especially
on Rosa's gel, for which you should also include the E. coli
rRNA):
log(kbp) = a + b*(cm) + (c/((cm)^d))
In the above, b should be negative, c should be positive, and d - the
exponent on the second cm term - should be greater than 1. Initial
values for a and b can be gotten off of a linear plot of log(kbp) vs cm,
getting a basic log(kbp) = a + b*(cm) line (which should fit properly
some of the points). You will probably need to use SigmaPlot to do
this curve-fitting; I doubt Kalideograph is capable of it, and I'm pretty
sure Excel isn't. Alternatively, you can draw a curve by hand using semi-log
paper or the equivalent; if you are interested in coming up with another
equation, please talk to Dr. Chase or myself - the ones built into
Kalidagraph, SigmaPlot, etcetera do not work, from prior
experience.
4/5/05:
A few things:
- If you can see the dye front on the gel, and marked or can see
the dye front on the blot, for getting Rms divide by the distance to
the dye front. Otherwise, divide by the distance to the end of the
gel/blot.
- For the RNA lab, do not use a straight line to fit points that
don't go on a straight line - Dr. Chase is grading it, and he
will take off for this (as would I, for that matter,
although I probably wouldn't be quite as picky...).
- I will be here today until midnight or so (at least), except
that I may go out to get some medicine (I think I'm coming down with
a head cold).
- In regard to question 1 in the plasmid lab, you can also use
combinations of appropriate restriction enzymes to do this, not just
concentrations - either answer is acceptable. Being a
geneticist, I would use restriction enzymes; being a biochemist,
Dr. Chase would use concentrations (I suspect). Gaah! I had
gone over with Dr. Chase a way to revise this question to make it
clear that more than the concentration answer was
acceptable. Instead, he's wanting both answers, and given that, to
be blunt, his answer involving concentrations has never made sense
to me, I can't help anyone with that portion of it - which, since
I'm grading it, doesn't work! You can skip either the
concentration-with-single-restriction-enzyme part of the answer, or
the multiple restriction enzymes part of the answer; if you put down
a concentration answer, I will probably wind up showing it to
Dr. Chase to see if he thinks it makes sense.
4/6/05:
Corrections to the plasmid lab manual (you will not be penalized for
mistakes due to the below if you've already turned it in, of course!):
- On page 13, EcoRI and HindIII cut at the ends of the insert (as
well as the ends of the polylinker).
- On page 27, step 7, the linear conformation of the plasmid may
or may not show up in lane 1 - it should show up (clearly -
more so than in lane 1) in lane 2. Use lane 2 for the linear form of
the plasmid if it's clearer than lane 1.
I'll be here tonight again until at least midnight, and things turned in to
me before I leave or before Dr. Chase gets here tomorrow (whichever happens
first) are counted as in today.
With regard to the RNA lab: It is rather difficult to find data on the size
of 25S rRNA, especially since it seems to vary slightly depending on species
of plant, plus fungi seem to also have 25S rRNA. Use 3400 bases.
4/12/05:
Wednesday students: Remember that you need to go to Foran Hall (I
think room 122, but I could be wrong!) tomorrow morning.
A few things regarding the RNA lab:
The due date for the RNA lab has been pushed back to this Friday
(4/15/05). However, turning it in on Saturday or Sunday will
be counted as 1 day late. (I'm not sure about this with
regard to Wednesday lab students, who would normally be turning the
lab in 1 day later than those in the Tuesday section - ask Dr.
Chase!) Corrected - see below.
- If you are using Rosa's gel, don't use the average of the sizes
(7.46 and 9.49 kb) for the top band - use just the lower one, unless
you can see two bands in the area labeled as 7.46 and 9.49 on the
sheet in the back of the lab manual.
- Sometimes, the equation above seems
to give an error in SigmaPlot of "array ill-conditioned on final
iteration" with the c term going through the roof (and the standard
error of said term going even bigger). A couple of
things that seem to help with this:
- Use 0.1, not 1, as a starting value for c.
- Double-check the position of the top band, and if you're
trying to fit two lines into it with 7.46 kb and 9.49 kb,
try just using 7.46 kb for the top band.
- Try the following alternate equation:
log(bp) = a + (b*cm) + (c/exp(cm))
As before, b should be constrained to be negative and c
should be constrained to be positive, with the starting
value for b being the slope of the linear fit and the
starting value for a being the intercept of the linear
fit. Note that the above uses log base 10, but the
exponentiation in the denominator has a base of e - for some
reason, it doesn't seem to work otherwise! Weird... I'm
still figuring this one out.
4/15/05:
The RNA lab is now due anytime this weekend for Tuesday lab students, and on
Monday for Wednesday lab students.
4/19/05:
The Sequencing lab is due the same date as the PCR lab (I believe this is
the 26th and 27th in the lab manual); I'll be grading it, while (so far as I
know) Laura will be grading the PCR lab (which doesn't have any account of
purification or whatever writeup). I'll put up more on what is expected for
the sequencing lab when I'm a bit more awake (no sleep last night...).
4/20/05:
Sigh... the PCR lab this year didn't work nearly as well as the
2003-2004 or last year's (about the same
as with 2003-2004); not sure why not, except for 3 groups on Tuesday that
made the same error (adding the PCR mix to their entire dilution instead of
to 5 ul of each dilution). We have decided to skip the PCR lab report - but
do keep in mind that you may be tested on it still on the final (both in PCR
questions and in regard to PCR and sequencing!). Laura and myself will be
splitting up the plasmid and sequencing lab grading to some degree - it
currently looks like she'll be grading the questions for the plasmid lab,
from the disk version so make sure you've gotten that to me! The procedural
writeup for the sequencing lab should be done about the same way as for the
plasmid lab - see above. For the analysis:
- Give the E-value (Expect) for DNA BLAST search results, and
preferably for other BLAST results.
- For protein results, including BLASTX with DNA-vs-protein, give
the percent identity. (My general rule of thumb, backed up with some
research, is that something at 65%+ identity is pretty definitely
similar (including in structure), that something at 30%+ identity is
possibly similar, and we can't really tell below that.)
- For any BLAST results, if there are any gaps, give the
"Gaps = #/# (#%)" info. (If there are any significant
number of gaps or the percent identity is below 65%, I tend to
treat the alignments as rather dubious - especially if both are
true!)
- For the protein sequences, the most informative will usually be
the SWISS-PROT references, which
look like "gi|#####|sp|" plus some other stuff.
- You should have three or so different very good matches to the
sequence. One of these should either be something from Dr. Zylstra
(the DNA sequences and maybe some of the protein sequences -
translated from the DNA sequence he deposited, probably) or should
include references to Dr. Zylstra (e.g., the SWISS-PROT material for
the protein sequences); this is the one to concentrate on, although
you should mention the other ones.
- Your DNA match should be to a DNA sequence record that is an
operon which codes for several different proteins. You should
determine (note the numbers on the "Sbjct" lines on
the alignment, at the beginning and end) to which protein-coding (or
multiple protein-coding) section your DNA sequence matches. The
description of this protein's function/reaction-catalyzed should
correspond to that of the first few proteins in the protein results.
- There are several ways to tell what area of your sequence is
reliable (ultimately, this is a subjective judgement, so what
matters is your justification - as long as your judgement is anywhere
near reasonable!):
- The beginning and end are usually less reliable, whereas
you can generally assume that the middle is correct unless
it's obvious that it had significant problems.
- Areas with lots of Ns, where the computer couldn't
decide what the nucleotide was, are problem areas.
- Areas where the peaks aren't clearly distinguishable for
which one is highest, or where the peaks aren't very sharp,
are problem areas.
- Once you've found corresponding sequences in Genbank
(via a DNA-vs-DNA BLAST search) and/or elsewhere, you can
examine when your sequence starts matching to the database
sequence (note the numbers on the "Query" lines on
the alignment, at the beginning and end) and when it stops
matching. In this, gaps are pretty definite indications of a
problem, BTW, at least if the database sequence is indeed
what you actually have. (Looking at this can also help you
conclude whether there's any vector/etcetera sequence in
what you have, although there's also a physical reason in
sequence why you would/wouldn't be able to see the
sequencing vector in use's sequence.)
- Except in the alignments, you don't need to give me the entire
class's full sequence, your full sequence, or the full sequences
from the database - just put in the first 10-15 or so letters, then
a "...", then the last 10-15 or so letters. (You should
also specifically include any section of the sequence that you
mention in the text - e.g., where it starts/stops corresponding to
yours.)
- You can also take a look at the
2001-2002 and
2003-2004
instructions for more of what I'm wanting - anything on this page
overrides that, of course, such as that we did have the
sequences fitting together pretty well unlike with the 2003-2004
sequences, so you should talk about that; there also may have been
some changes in the lab manual between then and now!
4/22/05:
I've gotten from Dr. Zylstra the files (accessible using
Chromas - this is
on the computers in 214, or can be downloaded from
http://www.technelysium.com.au/chromas_lite.html
for free) with your sequences and peaks in them:
There are, however, some revisions to what's wanted for the lab
report... Dr. Zylstra only had you do BLAST searches using the overall
sequence, apparently, so material dealing with BLAST searches using only
your group's sequence (or whatever you got given as a replacement if yours
didn't work) will be treated as extra credit (or, if you do searches for
your group's sequence instead of searches on the assembled/overall sequence,
I'll count your group's sequence searches as if they were searches using the
assembled/overall sequence). I am still trying to figure out any additional
changes to the requirements due to this; I will update this page with any
additional changes. My apologies about oversleeping during Dr. Zylstra's
lecture...
You will need to turn in another disk with the answers to the questions for
the sequencing lab on it, or (maybe) email them to Laura - check with her on
the latter! She and I are dividing up the plasmid and sequencing lab grading
with her grading the questions and my grading the other sections of the lab
reports, and we're doing this by my giving her the disks I've gotten (and
forwarding the plain text copies of the questions/answers I've
gotten) - you will be graded on the disk copy of the answers, not on what's
in your lab report, although you should probably still include a copy of the
answers in your lab report as a backup (in case of disk problems, for
instance).
4/22/05:
OK, a few things:
- In regard to the sequencing lab:
- You can extract your group's sequence from the Chromas
files above by going to the Edit
menu, clicking on "copy sequence to clipboard", and then
"copy plain text sequence" (or something like that).
- You can then compare it vs the whole-class sequence to
see where it is in that (more precisely than the info you
got earlier) and to see where along your sequence
that sequence starts/stops corresponding
with the whole class's sequence (which is
an indication,
along with looking at the Chromas results, of where your
sequence starts/stops being reliable -
maybe!), by going to
http://www.ncbi.nlm.nih.gov/blast/,
down to the the
bl2seq
link, then (for nucleotide sequences) increase the "open
gap" penalty to 6 and uncheck the "filter" box, then paste
your sequence into one box and the whole class's sequence
into the other box, then hit "Align". The resulting screen's
useful information should be included in your lab report,
especially the numbers at the ends of the alignment which
tell you where the two sequences corresponded. (The pictures
may show you this, but approximately, better than the
numbers, if you (unlike me!) think in pictures.)
- Note the "maybe!"
above in regard to how much the
alignment to the class's sequence tells you on the
reliability of your sequence. If your sequence is at the
beginning or end of the class' sequence, then the reliable
part may actually go on a bit further (before or after the
class' sequence, respectively) - we just discovered this
with a group that had a sequence that was from the end of
the class' sequence and had some more on the end that had some
possible problems with the peaks so it got chopped out by
SeqMan - but, when put into BLASTX, that part of that
group's sequence wound up matching to another protein that
is indeed from the same organism and operon (with
Dr. Zylstra's work being cited)! (I suspect that
SeqMan was being conservative because it didn't have any
other sequence (from another group) to match vs this
sequence.)
- For the questions on the sequencing lab, as well as
taking a look at my past webpages, note the following:
- Question 1: This is using Sanger dideoxy
sequencing, in an ideal world - as in, don't answer
the question according to whether the start of your
sequence has too much noise for anything to be read
there; answer it for the case of if the sequencing
worked perfectly.
- Question 2:
- You don't need to give the names of the
phosphates (alpha/beta/gamma or whatever),
just how close they are to the sugar/base
part of the dNTP (e.g., the phosphate
closest to the base or the phosphate
furthest from the base).
- For Maxim-Gilbert sequencing, you're
adding the phosphate (which you want to be
radiolabeled) only, not the entire ATP.
- Question 3: The oligo-dT primer thing is not a
seperate question; it is an attempt at clarifying
the meaning of the question. Please note the third
sentence!
- Remember that we are (or, rather, Laura is) grading the answers
to the questions for the plasmid and sequencing labs from the
on-disk versions - so if you think you may have made any changes in
your hard-copy version that weren't in the on-disk version (e.g.,
handwritten corrections), you need to let us know immediately! Even
more so, if you haven't given us a disk or gotten the answers to us
electronically another way, be sure to do so ASAP!
4/26/05:
Here is the information on
which sequence is which in the
Chromas-format files (this is the number after the "TC-").
- D (Dan/Paulo)
- B (Melissa/Carlo/Eric)
- J (Anthony/Justin/Kevin)
- H (Tanuja/Natalie)
- F (Lena/Polina/Kathy)
- E (Hedai/Keenan/Aaron)
- E (Chinua (sp?)/Chinelo/Purvaja)
- K (Kristin/Maria/Cisilya)
- G (Dante/Christina/Alex)
In regard to the blast searches, I am only expecting you to consult the
gene/protein records (the other page you get when you click on the sequence
names) if they're among the top few - e.g., ones as high in E-value (or
percent identity, for protein) as Dr. Zylstra's. The rest, down to a percent
identity (for protein) of 65% or (for nucleotides) up to an E-value of
0.001, you should summarize but do not need to go into specifically - just
state something about what the genes/proteins are (e.g., for an enzyme, what
reaction is it catalyzing? No detail is necessary - I am not a
biochemist!). You should give at least one reference from these records -
probably Dr. Zylstra's paper, which you should look at and preferably
include the abstract from.
I have put an example of the sequencing question I generally ask in
expbio.question.example.txt; it
also includes the grading master. Note that the sequence in the question
(and thus the master) varies from person to person, and that the
question itself may well be different this year.
In regard to Chromas, it appears that the version on
at least one of the computers in 214 is not Chromas Lite (the freeware
version) but has expired its free-use period; other computers in 214 may or
may not have Chromas Lite. If need be, download Chromas Lite and install it
- check with Peter Anderson (or myself if he's not available) if you are
uncertain about this.
In regard to question 2, part 2 in the sequencing lab, the entire ATP is not
added to the end of the DNA - just one phosphate from it.
In doing protein blasts (BLASTX/BLASTP), the sequence database references
tend to show up in groups with one alignment (the thing with
"query" and subject beside the lines with numbers and letters);
each sequence within the group is identical. You only need to work with one
of these, if any - just mention the presence of the others is enough. (The
ordering of which one comes first in such groupings is rather arbitrary,
BTW!)
I invite everyone who's around then to come to the party Dr. Kahn is holding
after the Cook College graduation - it's in Lipman Hall basement, on the
20th.
4/27/05:
If you wound up using a different Chromas file than the one given
above for your group, either because
Dr. Chase and myself were in error on the identification (quite possible for
Wednesday) or because you were looking at the letters and not the numbers or
something like that, it's fine - just make a note in your lab or, if you've
already turned it in, let me know about it.
5/5/05:
The exam is in Chemistry
204 at 12:00 noon on Friday, 5/6/05. Almost everyone's plasmid lab, and
something around a third to a half of the sequencing labs (and all of the
questions for both, thanks to Laura) are graded, and can be picked up from
Dr. Chase (or myself, if he's not around). I am not likely to be available
tonight or tomorrow morning - I will either be sleeping or grading the
remaining sequencing labs; sorry!
I am not enthused about the amount of memorization required for the
final exam. (Dr. Chase is not of the opinion that it is that heavy on
memorization - but he has an extremely good memory, so perhaps does
not fully realize how difficult memorization can be, especially for those of
us like me who have a bad memory. Incidentally, I recommend studying old
exams as the best way to do OK on the final - see
http://aesop.rutgers.edu/~dbm/tedchase.html
for old exams with answers (at the bottom of the page). For the spring
semester, I generally put together a question (either on plasmid assembly or
on dideoxynucleotide sequencing).) My disapproval of
memorization where not absolutely necessary is one reason that I don't give
in-class, closed-book quizzes except on safety matters - things that people
do need to know things off the tops of their heads, to
avoid endangering anyone. (I have a particular concern with regard to
harming other people - speaking from my
political/
ethical viewpoint, if someone harms
themselves when they knew
or could have known if they'd bothered to find out the danger,
that's their business (I find it unfortunate - I don't like
seeing people harm themselves - but freedom comes with responsibilities).
Unfortunately, the legal system in the US, and other governmental regulatory
means in most of the rest of the world, don't agree, and I do try to avoid
either getting other people in trouble or fighting fights I can't win
(yet).)
People frequently say that the lab takes more time than it should for the
number of credits. You are correct; Dr. Chase and I agree with you.
Unfortunately, it appears to be University policy, probably due to the
various humanities departments lobbying, to not count laboratory hours as
much as classroom hours - even if the laboratory in question has, like
Experimental Biochemistry, lab reports that require lots of time outside of
class. On the other hand, do realize that this is one of the more thorough
biochemistry (and related areas) laboratory courses that undergraduates might
ever take, and definitely gives people lots of experience - experience that
has meant the difference between getting a job and not getting a job for
some. (The course credit hours have been increased a bit via adding extra
time to the lecture, plus combining the course with Data Treatment, but it's
still too few credits in my opinion.)
I have suggested to Dr. Chase that the Rutgers Genetics course (as variable
in quality as I've heard it is - some report it being better-taught in the
summertime, BTW; I can personally recommend Dr. William Sofer - Bill Sofer -
as a teacher, although like everyone else he's human and does have limits to
his patience, which are sometimes reached around exam times for
Genetics/Molecular Genetics if 300 people are bombarding him with requests
for grade changes...), or some equivalent, be prerequisites or corequisites
for the second semester of Experimental Biochemistry - and may suggest this
also for the second semester of General Biochemistry - in light of the many
people coming to me needing help on what I, as a geneticist, would consider
very basic aspects of the plasmid, RNA, sequencing, and PCR labs. While this
would take too much wrangling to get through for next year, he is planning
on adding a strong recommendation for such a course to the description of
Experimental Biochemistry in the course catalog.
I am willing to spend quite a bit of time giving assistance, as you can see
from the scheduling comments above. Some (as
expressed in one anonymously-made comment) may be concerned about whether or
not the people I work with are doing enough on their own:
- When I work with people, I want them to do it
right. This has been known to result in doing somewhat more
work than the lab manual may technically call for (although this
also means that, at least if I'm grading it, the person can
get more extra credit if it's done right).
- Learning styles are quite variable. Sometimes, it takes telling
people things several different ways for them to get it. Sometimes,
it takes leading them through how to do something before they
understand it.
- If someone is asking questions instead of thinking (instead of
asking questions to check their thinking, or because of a
lack of clarity in what appears to be required or in how the
procedure is supposed to work, or because they've struggled with
trying to understand something but, perhaps because of the different
learning styles I just mentioned, just can't quite get it), then:
- This won't help the person on the exam - it'll hurt
them.
- People who don't understand what they're doing and are
just following directions tend to:
- get things wrong and either get points taken off
or have to go back and correct the errors, thus
doing more work; and/or
- not do a very good job of discussing their
results and answering the questions, thus getting
points off there - and, at least
if someone's in my lab section and it's a lab report
I'm grading, then how well you discuss your results
and answer the questions are a factor in your
subjective grade.
- I've gotten pretty good at not showing it, but I do have
a temper. Failing to think is an excellent
way to get me irritated.
Please do not let the above make you less likely
to seek help from me when you need it. While I am indeed irritated
when people fail to think, I find it just as irritating when people
fail to ask for help when they need it and I then have to deal with
the results, either in grading or in a laboratory procedure.
Tuesday Lab
My background: My primary background is in biology, specifically
molecular genetics. I am mainly qualified for this lab due to:
- prior lab experience, especially with DNA; and
- having TAed it before (this will be my 7th or so time for the fall
labs).
Getting in touch: The best means of getting in
touch with me is to come by
Lipman Hall
room 118/119, then try Lipman Hall 202 (the
SGI computer lab). (If the
building
is locked up, try the phone number given below - use the 119 number first in
that case.) The second best is to email me (see below
for the address), since I check my email several times most days. (Note the
points on my tutorials page about not sending
me email that's something other than plain text.) The third best is to call
me at 932-9255 extension 119 (202 if that doesn't work; 207 if at night and
neither 119 nor 202 have worked). (Do not assume that
I'll receive voicemail; only use this method if I (or someone else) answers the
call.) The fourth best is to put a note in my box; it is on the first floor of
Lipman Hall. (By the way, if you are turning in a lab report other than
directly to a TA or to Dr. Chase (preferably not into a mailbox - try under
the door of Dr. Chase's office), be sure to get someone - a secretary,
professor, graduate student, whoever, just someone other than another
undergraduate - to sign and date it so we don't have to count off for
lateness (or for any more lateness than you should have been counted off
for).
Office Hours: I will try to let you know what times I will be
available (usually I'll be in and available a lot immediately prior to when
each lab report is due); the best thing to do is to simply ask whether I
will be available at a given time - people who've had me (as a TA) before
can tell you that I am willing (unless other obligations, including my own
academics and my need for sleep, conflict) to work with people at quite odd
times and/or for very long hours.
Quizzes: My quizzes have as their primary purpose encouraging you to
have read over the lab before you come in and making sure that you
know, in particular, safety-related information. I do not expect you
to have memorized all of it; my own memory isn't that good, and I will
generally consult the lab manual before answering questions - but I
will have read over the lab. I expect you to know in general terms
what we are supposed to be doing that day and about any safety
precautions that you need to take, particularly those which can affect
other people. I may - I generally don't unless I get inspired or feel
that you aren't reading over things - give you a take-home,
open-library quiz (or at least a question or two, if not a full quiz)
that is for the next week's lab, again mainly to encourage you to read
it over. Except for take-home quizzes and safety quizzes, I will not ask for
any further quiz-taking.
Subjective Grade: How I do the subjective grade is to note down when
you do something good, and when you do something bad. I will fix a
particular starting grade, and doing something bad will decrease your
subjective grade below this; doing something good will increase it
above this. The starting grade and amount up/down will be determined
by whatever gives a final mean of 85 and a high of 100. Examples of
good and bad things:
- Good things:
- asking an intelligent question;
- giving an intelligent answer on a quiz;
- giving an amusing answer on a quiz;
- typing a take-home quiz;
- typing lab reports, particularly the ones that I grade (which
are the protein (not enzyme!), gel electrophoresis and
isoelectric focusing ones for the Fall Semester);
- doing significantly more work than other people;
- giving a good answer to the questions on a lab that I grade;
- helping someone else in the lab (especially someone not your lab
partner);
- cleaning up messes that you didn't create;
- doing extra work because of things that aren't your fault;
- pointing out problems to us (especially if you provide the
solution also);
- for the Spring Semester, choosing to do the Carotenoid lab
(generally considered harder but more interesting - there have been
exceptions to this, depending on sources of material chosen,
however; I recommend nuts as a source) if most people are
choosing to do the Lipid lab - or vice-versa, if that happens
- Bad things:
- asking a question that makes it apparent that you haven't
read over the lab (having read over it and not understanding it
due to writing style, lack of clarity, or whatever - different
people understand different ways of putting things, after all -
is not, however, a problem at all, and if it leads me to make
suggestions to Dr. Chase as to how the lab manual can be
improved, can get you an increased subjective grade);
- doing something that makes it apparent you haven't read over the
lab (more off for this than the first - if you don't know
something, do ask);
- coming in more than 15 or so minutes late without an
adequate excuse (this may also result in your missing a quiz -
which you will not be able to make up without a good
excuse for coming in that late);
- leaving a mess that I or Emilia have to clean up
(particularly the latter, if she has cause to complain to me);
- doing significantly less work than your lab partners;
- doing something that irritates your lab partners (unless you
and they come to me and/or Dr. Chase and explain the problem and we
decide you're in the right)
I normally find I have more +'s than -'s by the end of a
semester. This means that those who do get significant minuses (e.g.,
a lab group a bit back that left lots of gunk in the pig kidney
centrifuge bottles...) will get a rather low subjective grade, and
that those who simply don't do much either positive or negative won't
get a particularly good one.
Nametags: I have problems remembering people's names (including close
friends and relatives, BTW!), especially in a class of 20+ people. This
sometimes causes problems with assigning subjective grades. Something I'm
trying out this year is to have everyone fill out and wear a nametag. These
should be left in the lab, to avoid losing them. At least for the fall
semester, if you forget to wear it, that will be subjective points off; if
you lose yours, that will be even more subjective points off
especially since I bought them with my own money!
Curving: I normally will try to curve to a mean of 85 and a high of 100
(although I normally do not curve down). On lab reports and quizzes, I'll
circle the final grade that you'll get for each of them. Such curving does
not include extra credit points or points taken off for lateness.
This is viewable in
Any Browser
and is Valid HTML 4.01.
Page written by E. Allen Smith (send mail to
meatcan2@beatrice.rutgers.edu,
substituting easmith for meatcan2 - do not just use the
mailto link! - see
my antispam page(s) for
why).
I am not responsible for any pages linked from these, except for
those that I have written. Neither is the
Structural Biology Computational Laboratory,
the Department of
Biochemistry and Microbiology,
Cook College,
or Rutgers University responsible
for (or have any copyright on) pages that I have written. My webpages are
not official Rutgers webpages.
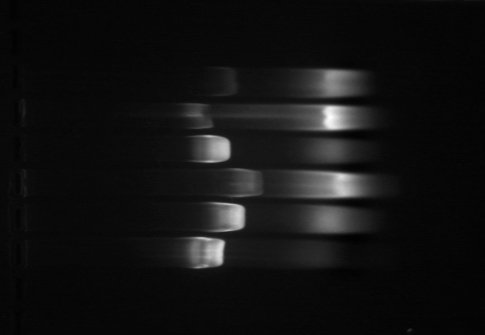
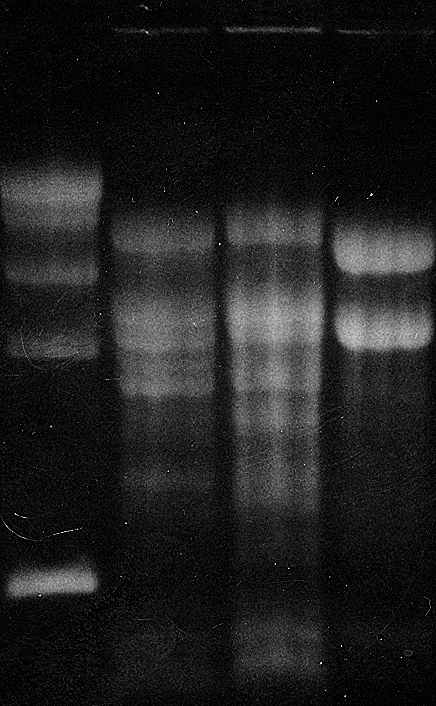